What are startup projects missing when compared to big corporations?
The differences between working in a startup and corporate environment are quite notorious. From the project budget to headcount, to alliances and partnerships that makes your work far easier. In all my years as an Android Developer, I would say that the biggest difference between an app developed in a startup and a big company is analytics.
In a young company, analytics is an afterthought. Feature work takes priority, and often resources are limited. And if you do have analytics, they are the bare minimum such as:
- Number of visitors/daily users
- Number of downloads
- Rating in app stores
- Number of crashes
All of which are pretty much provided for free by the platform you choose to publish your app on.
At big companies, analytics and feature work go hand in hand, and often you don’t release one without having the other on point. The number of downloads or the big new feature are not what drives business, analytics does.
Good analytics allows you to:
- Gain user insights
- Discover choke points in your processes
- Help in resolving crashes and other issues your users are reporting through other means (customer service, reviews, etc.)
- Take better business decisions
You might be thinking, “That’s great and all, but I don’t have the time or budget to invest heavily on analytics right now.” Don’t worry about it; I’m going to tell you how to bootstrap this thing.
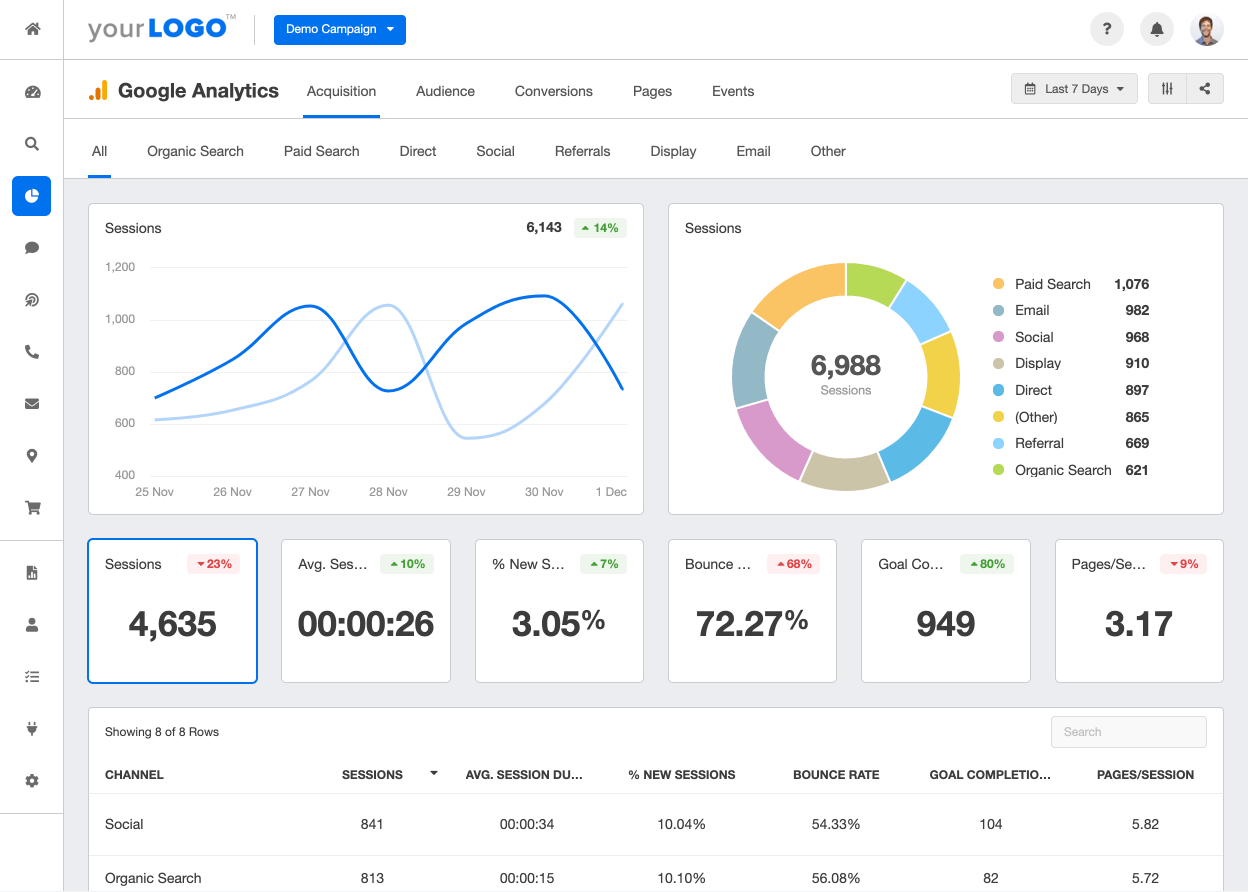
Google Analytics for Firebase
Firebase is like a Swiss Army knife; it provides a lot of different services like database and app distribution. But today we are going to focus on Google Analytics for Firebase. Analytics is a free product inside Firebase, and it is compatible with pretty much any platform you can imagine; you can even use it in Unity (Apple Vision Pro anyone?).
Just by using their SDK you will begin logging a lot of information about your users: demographics, retention, engagement and even revenue (if configured properly). The ability to log unlimited custom events will empower your analytics to the cloud (pun intended). If you combine all of this with Crashlytics, their crash analytics suite, you can have an even better image of what is impacting your users and how to fix it or take advantage of it.
Audiences will allow you to group users by demographics, location, spending habits, and more. Once you have your audience defined, you can provide custom experiences to them or reach them with custom notifications or offers. Imagine you want to promote booking for your Caribbean resorts. Simply create an audience for people that want to escape winter and you are good to go.
Lastly, this being a Google product integration with ad networks, you can see campaign results and conversions right there.
Segment by Twilio
Segment is the next level in my opinion; it is not a replacement for what products like Google Analytics offers, but their integrations are more advanced. Let me explain more. Segment allows you to define information pipelines and the information can come from anywhere: your own custom logs, Google Analytics, 3rd party websites, you name it. You process the information and act.
Examples
Let’s say you have a mobile game and want to send a promotional code when a user invites X number of friends to play. You can send an event log for each invite (as per the usual) and configure Segment to send an email when a specific event happens.
Create a customer service ticket when an unexpected error happens and it’s likely that your user will contact you for resolution. For example, if the costumer card was declined or blocked.
The power of Datadog to improve your App
Datadog is my wildcard. While they don’t sell themselves as an analytics software, the logging capabilities, querying of big data, and custom dashboard can make it a viable alternative – especially if you already use it for monitoring. Datadog is not as user friendly as the other alternatives since it requires a more complicated setup, but it can be extremely powerful in the right hands.
As a dev, I really liked how easy it is to send structured data (not just the classic logs) to DataDog. You can also create pipelines to sanitize the data, interpret it, and make it available for searching.
Two of the coolest features that DataDog has are Real User Monitoring (RUM) and Session Replay. The ability to see what the user was doing before or during a crash, as if you were watching over the shoulder, is just game changing when fixing bugs. Session Replay is only available for Web now, but there are other services (like QuantumMetric) that offer the same features for more platforms.
Conclusion: Your app should not go blind without Analytics
I hope this brief introduction to analytics can open your mind to things you might be missing. Remember that if you cannot measure it, you cannot improve it. If you want to know more about how to implement analytics on your website or apps, give us a call. We will be more than happy to help you out.